|
FY2013 House 1 |
FY2013 House Final |
FY2013 Senate Final |
FY2013 GAA |
|
|---|---|---|---|---|
| Budget Tracking | 68,893,835 | 68,893,835 | 68,893,835 | 68,893,835 |
|
FY2010 GAA |
FY2011 GAA |
FY2012 GAA |
FY2012 Projected |
FY2013 GAA |
|
|---|---|---|---|---|---|
| Historical Budget Levels | 77,844,056 | 75,230,149 | 64,386,762 | 64,386,761 | 68,893,835 |
* GAA is General Appropriation Act.
| SPENDING CATEGORY |
FY2009 Expended |
FY2010 Expended |
FY2011 Expended |
FY2012 Projected |
FY2013 GAA |
|---|---|---|---|---|---|
| Employee Benefits | 81,407 | 71,049 | 66,098 | 64,381 | 68,888 |
| Operating Expenses | 0 | 0 | 0 | 6 | 6 |
| TOTAL | 81,407 | 71,049 | 66,098 | 64,387 | 68,894 |
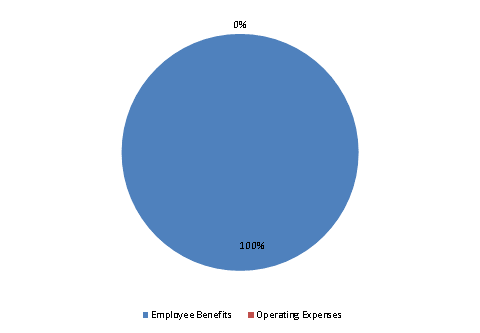
FY2013 Spending Category Chart