|
FY2013 House 1 |
FY2013 House Final |
FY2013 Senate Final |
FY2013 GAA |
|
|---|---|---|---|---|
| Budget Tracking | 1,147,002,702 | 1,228,002,702 | 1,223,126,679 | 1,223,126,679 |
|
FY2010 GAA |
FY2011 GAA |
FY2012 GAA |
FY2012 Projected |
FY2013 GAA |
|
|---|---|---|---|---|---|
| Historical Budget Levels | 959,909,873 | 1,160,940,774 | 1,131,305,510 | 1,123,305,510 | 1,223,126,679 |
* GAA is General Appropriation Act.
| SPENDING CATEGORY |
FY2009 Expended |
FY2010 Expended |
FY2011 Expended |
FY2012 Projected |
FY2013 GAA |
|---|---|---|---|---|---|
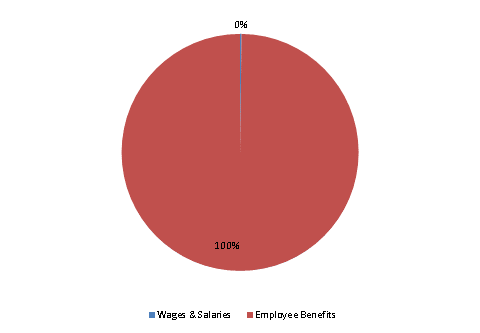
| Wages & Salaries | 1,032 | 1,341 | 1,560 | 2,536 | 2,367 |
| Employee Benefits | 878,653 | 980,103 | 1,050,737 | 1,120,770 | 1,220,760 |
| Operating Expenses | 759 | 0 | 183 | 0 | 0 |
| TOTAL | 880,445 | 981,444 | 1,052,480 | 1,123,306 | 1,223,127 |
FY2013 Spending Category Chart
