|
FY2013 House 1 |
FY2013 House Final |
FY2013 Senate Final |
FY2013 GAA |
|
|---|---|---|---|---|
| Budget Tracking | 2,537,146 | 2,337,203 | 2,537,146 | 2,337,203 |
|
FY2010 GAA |
FY2011 GAA |
FY2012 GAA |
FY2012 Projected |
FY2013 GAA |
|
|---|---|---|---|---|---|
| Historical Budget Levels | 2,704,328 | 2,445,379 | 2,561,709 | 2,561,709 | 2,337,203 |
* GAA is General Appropriation Act.
| SPENDING CATEGORY |
FY2009 Expended |
FY2010 Expended |
FY2011 Expended |
FY2012 Projected |
FY2013 GAA |
|---|---|---|---|---|---|
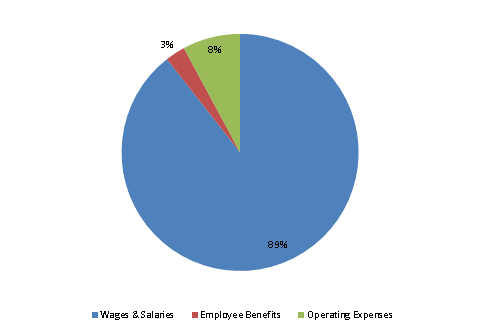
| Wages & Salaries | 2,664 | 2,390 | 2,225 | 2,176 | 2,090 |
| Employee Benefits | 45 | 48 | 47 | 92 | 63 |
| Operating Expenses | 186 | 99 | 64 | 293 | 184 |
| TOTAL | 2,896 | 2,537 | 2,336 | 2,562 | 2,337 |
FY2013 Spending Category Chart