|
FY2013 House 1 |
FY2013 House Final |
FY2013 Senate Final |
FY2013 GAA |
|
|---|---|---|---|---|
| Budget Tracking | 600,000 | 600,000 | 600,000 | 600,000 |
|
FY2010 GAA |
FY2011 GAA |
FY2012 GAA |
FY2012 Projected |
FY2013 GAA |
|
|---|---|---|---|---|---|
| Historical Budget Levels | 404,250 | 600,000 | 600,000 | 350,000 | 600,000 |
* GAA is General Appropriation Act.
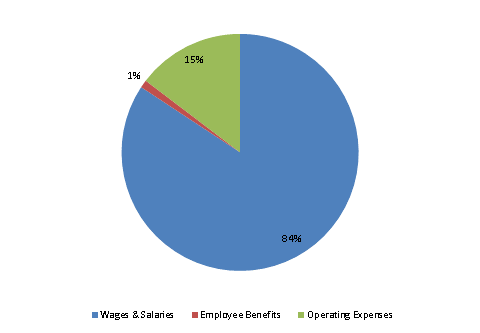
| SPENDING CATEGORY |
FY2009 Expended |
FY2010 Expended |
FY2011 Expended |
FY2012 Projected |
FY2013 GAA |
|---|---|---|---|---|---|
| Wages & Salaries | 322 | 292 | 395 | 350 | 506 |
| Employee Benefits | 4 | 4 | 10 | 0 | 6 |
| Operating Expenses | 105 | 108 | 118 | 0 | 88 |
| TOTAL | 431 | 404 | 523 | 350 | 600 |
FY2013 Spending Category Chart