|
FY2013 House 1 |
FY2013 House Final |
FY2013 Senate Final |
FY2013 GAA |
|
|---|---|---|---|---|
| Budget Tracking | 2,355,145 | 2,355,145 | 2,355,145 | 2,355,145 |
|
FY2010 GAA |
FY2011 GAA |
FY2012 GAA |
FY2012 Projected |
FY2013 GAA |
|
|---|---|---|---|---|---|
| Historical Budget Levels | 2,355,145 | 2,355,145 | 2,355,145 | 2,355,145 | 2,355,145 |
* GAA is General Appropriation Act.
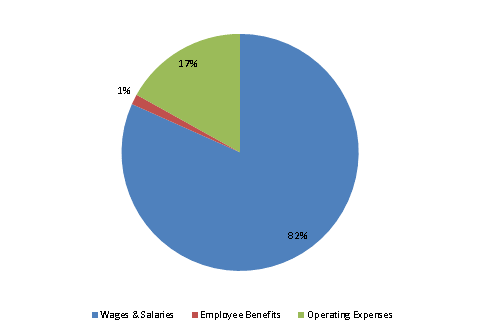
| SPENDING CATEGORY |
FY2009 Expended |
FY2010 Expended |
FY2011 Expended |
FY2012 Projected |
FY2013 GAA |
|---|---|---|---|---|---|
| Wages & Salaries | 1,654 | 1,724 | 1,660 | 1,887 | 1,924 |
| Employee Benefits | 43 | 42 | 44 | 59 | 33 |
| Operating Expenses | 406 | 398 | 421 | 409 | 398 |
| TOTAL | 2,103 | 2,163 | 2,124 | 2,355 | 2,355 |
FY2013 Spending Category Chart