|
FY2013 House 1 |
FY2013 House Final |
FY2013 Senate Final |
FY2013 GAA |
|
|---|---|---|---|---|
| Budget Tracking | 4,983,716 | 5,104,790 | 5,232,902 | 5,232,902 |
|
FY2010 GAA |
FY2011 GAA |
FY2012 GAA |
FY2012 Projected |
FY2013 GAA |
|
|---|---|---|---|---|---|
| Historical Budget Levels | 4,746,396 | 4,698,932 | 4,983,716 | 5,116,624 | 5,232,902 |
* GAA is General Appropriation Act.
| SPENDING CATEGORY |
FY2009 Expended |
FY2010 Expended |
FY2011 Expended |
FY2012 Projected |
FY2013 GAA |
|---|---|---|---|---|---|
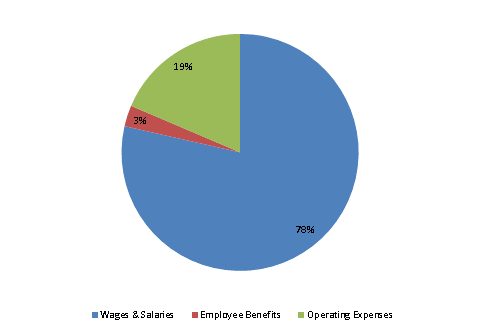
| Wages & Salaries | 3,676 | 3,488 | 3,616 | 3,979 | 4,111 |
| Employee Benefits | 130 | 110 | 128 | 150 | 150 |
| Operating Expenses | 1,171 | 975 | 962 | 987 | 973 |
| TOTAL | 4,977 | 4,573 | 4,706 | 5,117 | 5,233 |
FY2013 Spending Category Chart
