|
FY2013 House 1 |
FY2013 House Final |
FY2013 Senate Final |
FY2013 GAA |
|
|---|---|---|---|---|
| Budget Tracking | 8,004,233 | 8,198,688 | 8,404,444 | 8,404,444 |
|
FY2010 GAA |
FY2011 GAA |
FY2012 GAA |
FY2012 Projected |
FY2013 GAA |
|
|---|---|---|---|---|---|
| Historical Budget Levels | 7,623,079 | 7,546,848 | 8,004,233 | 8,297,076 | 8,404,444 |
* GAA is General Appropriation Act.
| SPENDING CATEGORY |
FY2009 Expended |
FY2010 Expended |
FY2011 Expended |
FY2012 Projected |
FY2013 GAA |
|---|---|---|---|---|---|
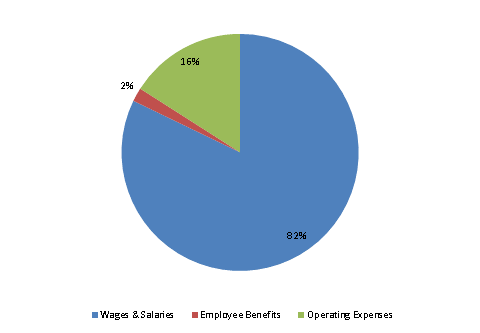
| Wages & Salaries | 7,231 | 7,239 | 7,007 | 7,138 | 6,905 |
| Employee Benefits | 130 | 124 | 140 | 154 | 158 |
| Operating Expenses | 751 | 260 | 544 | 1,005 | 1,341 |
| TOTAL | 8,112 | 7,623 | 7,691 | 8,297 | 8,404 |
FY2013 Spending Category Chart
