|
FY2013 House 1 |
FY2013 House Final |
FY2013 Senate Final |
FY2013 GAA |
|
|---|---|---|---|---|
| Budget Tracking | 8,411,609 | 8,615,961 | 8,832,189 | 8,832,189 |
|
FY2010 GAA |
FY2011 GAA |
FY2012 GAA |
FY2012 Projected |
FY2013 GAA |
|
|---|---|---|---|---|---|
| Historical Budget Levels | 8,011,057 | 7,930,945 | 8,411,609 | 8,451,608 | 8,832,189 |
* GAA is General Appropriation Act.
| SPENDING CATEGORY |
FY2009 Expended |
FY2010 Expended |
FY2011 Expended |
FY2012 Projected |
FY2013 GAA |
|---|---|---|---|---|---|
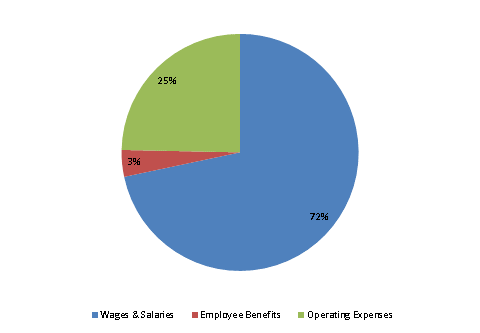
| Wages & Salaries | 7,801 | 7,140 | 7,107 | 7,260 | 6,332 |
| Employee Benefits | 134 | 105 | 149 | 162 | 322 |
| Operating Expenses | 597 | 766 | 755 | 1,030 | 2,179 |
| TOTAL | 8,533 | 8,011 | 8,011 | 8,452 | 8,832 |
FY2013 Spending Category Chart
