|
FY2013 House 1 |
FY2013 House Final |
FY2013 Senate Final |
FY2013 GAA |
|
|---|---|---|---|---|
| Budget Tracking | 13,690,462 | 14,023,058 | 14,374,985 | 14,374,985 |
|
FY2010 GAA |
FY2011 GAA |
FY2012 GAA |
FY2012 Projected |
FY2013 GAA |
|
|---|---|---|---|---|---|
| Historical Budget Levels | 13,038,535 | 12,908,150 | 13,690,462 | 13,770,463 | 14,374,985 |
* GAA is General Appropriation Act.
| SPENDING CATEGORY |
FY2009 Expended |
FY2010 Expended |
FY2011 Expended |
FY2012 Projected |
FY2013 GAA |
|---|---|---|---|---|---|
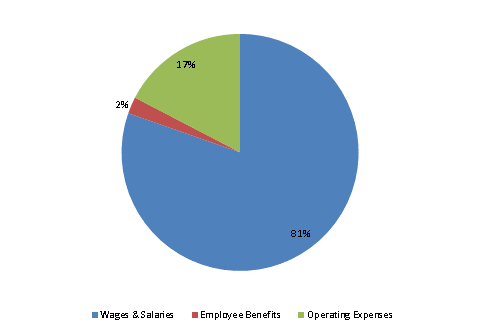
| Wages & Salaries | 10,853 | 10,082 | 10,232 | 11,636 | 11,552 |
| Employee Benefits | 205 | 185 | 243 | 274 | 328 |
| Operating Expenses | 2,832 | 2,771 | 2,564 | 1,860 | 2,495 |
| TOTAL | 13,890 | 13,039 | 13,039 | 13,770 | 14,375 |
FY2013 Spending Category Chart
