|
FY2013 House 1 |
FY2013 House Final |
FY2013 Senate Final |
FY2013 GAA |
|
|---|---|---|---|---|
| Budget Tracking | 2,442,950 | 2,335,818 | 2,442,950 | 2,448,838 |
|
FY2010 GAA |
FY2011 GAA |
FY2012 GAA |
FY2012 Projected |
FY2013 GAA |
|
|---|---|---|---|---|---|
| Historical Budget Levels | 2,412,913 | 2,398,691 | 2,335,818 | 2,442,951 | 2,448,838 |
* GAA is General Appropriation Act.
| SPENDING CATEGORY |
FY2009 Expended |
FY2010 Expended |
FY2011 Expended |
FY2012 Projected |
FY2013 GAA |
|---|---|---|---|---|---|
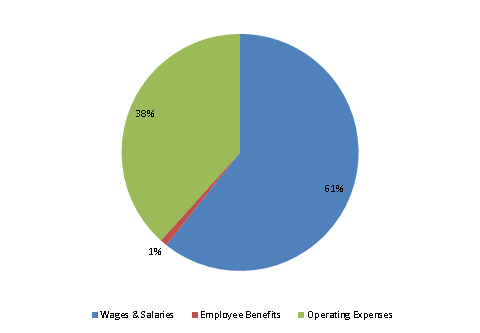
| Wages & Salaries | 1,710 | 1,746 | 2,036 | 1,453 | 1,486 |
| Employee Benefits | 22 | 24 | 39 | 36 | 24 |
| Operating Expenses | 1,091 | 626 | 323 | 954 | 939 |
| TOTAL | 2,823 | 2,396 | 2,398 | 2,443 | 2,449 |
FY2013 Spending Category Chart
