|
FY2013 House 1 |
FY2013 House Final |
FY2013 Senate Final |
FY2013 GAA |
|
|---|---|---|---|---|
| Budget Tracking | 379,996,119 | 209,775,080 | 205,790,613 | 217,180,156 |
|
FY2010 GAA |
FY2011 GAA |
FY2012 GAA |
FY2012 Projected |
FY2013 GAA |
|
|---|---|---|---|---|---|
| Historical Budget Levels | 190,422,288 | 188,247,375 | 185,437,997 | 201,239,224 | 217,180,156 |
* GAA is General Appropriation Act.
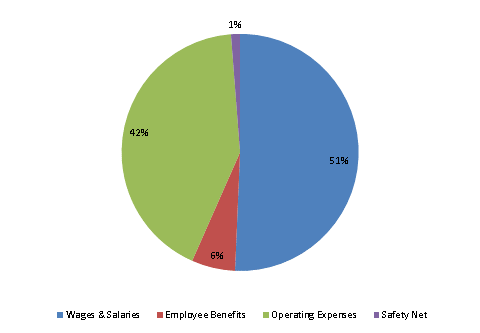
| SPENDING CATEGORY |
FY2009 Expended |
FY2010 Expended |
FY2011 Expended |
FY2012 Projected |
FY2013 GAA |
|---|---|---|---|---|---|
| Wages & Salaries | 39,126 | 95,916 | 108,876 | 99,412 | 110,076 |
| Employee Benefits | 11,624 | 11,583 | 11,667 | 13,721 | 12,890 |
| Operating Expenses | 82,879 | 77,074 | 72,811 | 85,233 | 91,540 |
| Safety Net | 2,773 | 2,934 | 2,943 | 2,872 | 2,675 |
| TOTAL | 136,402 | 187,508 | 196,297 | 201,239 | 217,180 |
FY2013 Spending Category Chart