Quick Links
- Statewide Summary
- All Account Listing
- Veto Listing
- Local Aid - Section 3
- Outside Sections
- Downloads
- Navigation Guide
- Budget Glossary
- Helpful Links
Budget Detail
4000-0700 - MassHealth Fee-for-Service Payments
Data Current as of: 7/7/2012
|
FY2013 House 1 |
FY2013 House Final |
FY2013 Senate Final |
FY2013 GAA |
|
|---|---|---|---|---|
| Budget Tracking | 1,939,680,126 | 1,954,480,126 | 1,933,730,126 | 1,957,480,126 |
|
FY2010 GAA |
FY2011 GAA |
FY2012 GAA |
FY2012 Projected |
FY2013 GAA |
|
|---|---|---|---|---|---|
| Historical Budget Levels | 1,607,619,796 | 1,667,529,464 | 2,029,206,633 | 1,872,641,363 | 1,957,480,126 |
* GAA is General Appropriation Act.
| SPENDING CATEGORY |
FY2009 Expended |
FY2010 Expended |
FY2011 Expended |
FY2012 Projected |
FY2013 GAA |
|---|---|---|---|---|---|
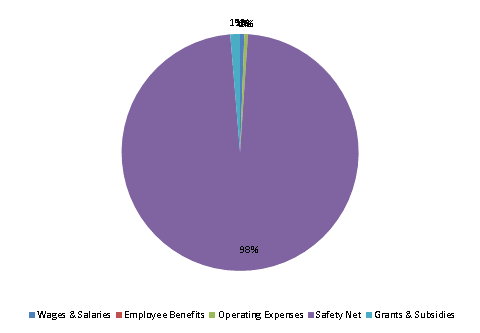
| Wages & Salaries | 7,872 | 9,605 | 9,586 | 11,873 | 11,232 |
| Employee Benefits | 3 | 9 | 7 | 9 | 7 |
| Operating Expenses | 9,682 | 9,387 | 11,217 | 9,521 | 9,620 |
| Safety Net | 1,531,272 | 1,683,995 | 1,839,864 | 1,848,239 | 1,910,621 |
| Grants & Subsidies | 0 | 15,550 | 5,130 | 3,000 | 26,000 |
| TOTAL | 1,548,829 | 1,718,547 | 1,865,804 | 1,872,641 | 1,957,480 |
FY2013 Spending Category Chart
