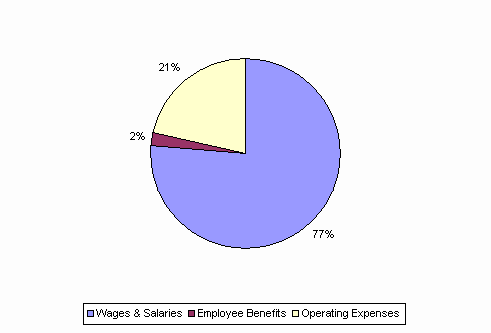
| SPENDING CATEGORY |
FY2008 Expended |
FY2009 Expended |
FY2010 Expended |
FY2011 Projected |
FY2012 GAA |
|---|---|---|---|---|---|
| Wages & Salaries | 980 | 933 | 947 | 983 | 979 |
| Employee Benefits | 40 | 24 | 22 | 27 | 28 |
| Operating Expenses | 248 | 230 | 179 | 227 | 273 |
| Grants & Subsidies | 578 | 472 | 50 | 0 | 0 |
| TOTAL | 1,846 | 1,658 | 1,198 | 1,238 | 1,280 |
FY2012 Spending Category Chart