| SPENDING CATEGORY |
FY2008 Expended |
FY2009 Expended |
FY2010 Expended |
FY2011 Projected |
FY2012 GAA |
|---|---|---|---|---|---|
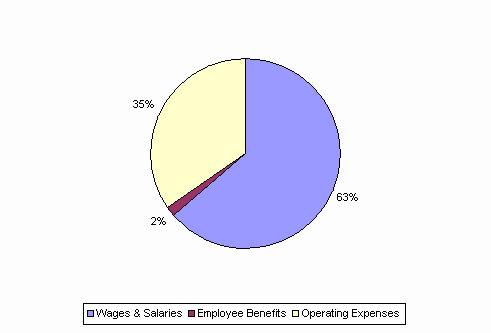
| Wages & Salaries | 13,325 | 14,493 | 13,651 | 13,932 | 14,055 |
| Employee Benefits | 363 | 391 | 296 | 373 | 345 |
| Operating Expenses | 10,108 | 10,277 | 8,834 | 7,942 | 7,665 |
| TOTAL | 23,797 | 25,161 | 22,781 | 22,247 | 22,064 |
FY2012 Spending Category Chart
