|
FY2012 House 1 |
FY2012 House Final |
FY2012 Senate Final |
FY2012 GAA |
|
|---|---|---|---|---|
| Budget Tracking | 88,042,732 | 88,042,732 | 88,042,732 | 88,042,732 |
|
FY2009 GAA |
FY2010 GAA |
FY2011 GAA |
FY2011 Projected |
FY2012 GAA |
|
|---|---|---|---|---|---|
| Historical Budget Levels | 0 | 0 | 84,531,407 | 89,839,522 | 88,042,732 |
* GAA is General Appropriation Act.
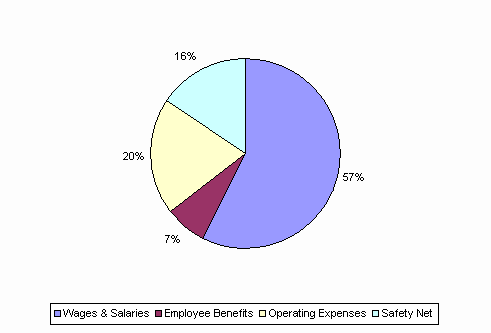
| SPENDING CATEGORY |
FY2008 Expended |
FY2009 Expended |
FY2010 Expended |
FY2011 Projected |
FY2012 GAA |
|---|---|---|---|---|---|
| Wages & Salaries | 0 | 0 | 36,305 | 53,823 | 50,589 |
| Employee Benefits | 0 | 0 | 1,106 | 6,162 | 6,030 |
| Operating Expenses | 0 | 0 | 6,163 | 15,396 | 17,668 |
| Safety Net | 0 | 0 | 1,232 | 14,459 | 13,757 |
| TOTAL | 0 | 0 | 44,807 | 89,840 | 88,043 |
FY2012 Spending Category Chart