|
FY2012 House 1 |
FY2012 House Final |
FY2012 Senate Final |
FY2012 GAA |
|
|---|---|---|---|---|
| Budget Tracking | 43,356,922 | 43,356,922 | 43,356,922 | 43,356,922 |
|
FY2009 GAA |
FY2010 GAA |
FY2011 GAA |
FY2011 Projected |
FY2012 GAA |
|
|---|---|---|---|---|---|
| Historical Budget Levels | 50,324,103 | 45,140,720 | 44,016,716 | 47,109,434 | 43,356,922 |
* GAA is General Appropriation Act.
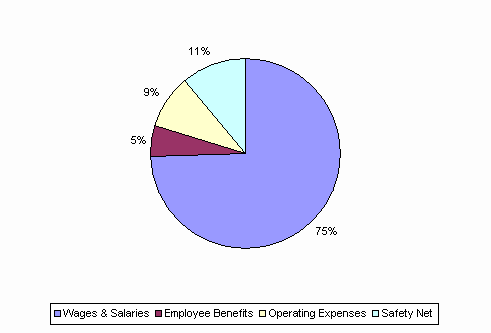
| SPENDING CATEGORY |
FY2008 Expended |
FY2009 Expended |
FY2010 Expended |
FY2011 Projected |
FY2012 GAA |
|---|---|---|---|---|---|
| Wages & Salaries | 37,559 | 37,284 | 34,291 | 35,298 | 32,265 |
| Employee Benefits | 2,511 | 2,268 | 2,265 | 2,437 | 2,287 |
| Operating Expenses | 4,286 | 4,328 | 3,862 | 4,167 | 3,943 |
| Safety Net | 5,152 | 5,185 | 4,723 | 5,208 | 4,862 |
| TOTAL | 49,509 | 49,065 | 45,141 | 47,109 | 43,357 |
FY2012 Spending Category Chart