|
FY2012 House 1 |
FY2012 House Final |
FY2012 Senate Final |
FY2012 GAA |
|
|---|---|---|---|---|
| Budget Tracking | 64,209,988 | 64,209,988 | 64,209,988 | 64,209,988 |
|
FY2009 GAA |
FY2010 GAA |
FY2011 GAA |
FY2011 Projected |
FY2012 GAA |
|
|---|---|---|---|---|---|
| Historical Budget Levels | 73,973,122 | 66,350,440 | 64,698,314 | 65,520,396 | 64,209,988 |
* GAA is General Appropriation Act.
| SPENDING CATEGORY |
FY2008 Expended |
FY2009 Expended |
FY2010 Expended |
FY2011 Projected |
FY2012 GAA |
|---|---|---|---|---|---|
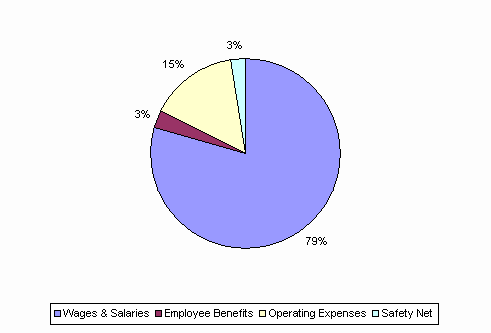
| Wages & Salaries | 55,191 | 55,743 | 51,917 | 52,231 | 51,030 |
| Employee Benefits | 1,565 | 1,555 | 1,597 | 1,865 | 1,881 |
| Operating Expenses | 12,122 | 11,266 | 10,337 | 9,744 | 9,621 |
| Safety Net | 3,141 | 2,556 | 1,879 | 1,680 | 1,677 |
| TOTAL | 72,019 | 71,120 | 65,731 | 65,520 | 64,210 |
FY2012 Spending Category Chart
