|
FY2012 House 1 |
FY2012 House Final |
FY2012 Senate Final |
FY2012 GAA |
|
|---|---|---|---|---|
| Budget Tracking | 2,541,372 | 2,531,924 | 2,106,449 | 2,365,650 |
|
FY2009 GAA |
FY2010 GAA |
FY2011 GAA |
FY2011 Projected |
FY2012 GAA |
|
|---|---|---|---|---|---|
| Historical Budget Levels | 6,732,924 | 2,123,066 | 1,991,372 | 1,991,372 | 2,365,650 |
* GAA is General Appropriation Act.
| SPENDING CATEGORY |
FY2008 Expended |
FY2009 Expended |
FY2010 Expended |
FY2011 Projected |
FY2012 GAA |
|---|---|---|---|---|---|
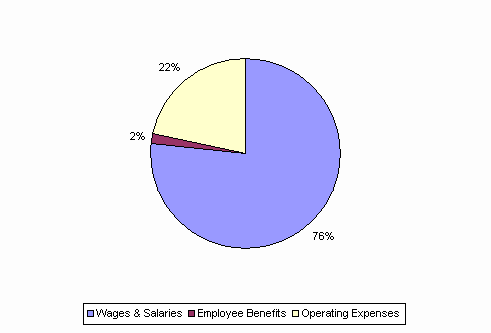
| Wages & Salaries | 3,260 | 3,306 | 1,712 | 1,759 | 1,815 |
| Employee Benefits | 49 | 51 | 29 | 45 | 39 |
| Operating Expenses | 2,877 | 2,881 | 208 | 187 | 511 |
| TOTAL | 6,185 | 6,238 | 1,950 | 1,991 | 2,366 |
FY2012 Spending Category Chart
