|
FY2012 House 1 |
FY2012 House Final |
FY2012 Senate Final |
FY2012 GAA |
|
|---|---|---|---|---|
| Budget Tracking | 16,218,556 | 16,305,635 | 16,305,635 | 16,305,635 |
|
FY2009 GAA |
FY2010 GAA |
FY2011 GAA |
FY2011 Projected |
FY2012 GAA |
|
|---|---|---|---|---|---|
| Historical Budget Levels | 19,164,450 | 16,000,413 | 16,453,017 | 16,502,174 | 16,305,635 |
* GAA is General Appropriation Act.
| SPENDING CATEGORY |
FY2008 Expended |
FY2009 Expended |
FY2010 Expended |
FY2011 Projected |
FY2012 GAA |
|---|---|---|---|---|---|
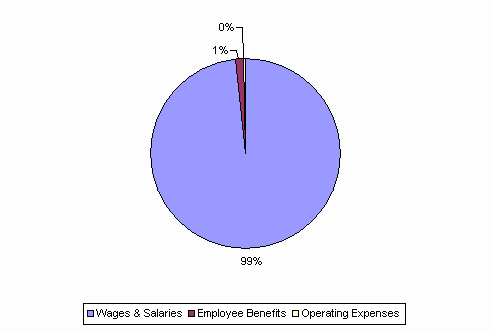
| Wages & Salaries | 18,512 | 17,810 | 14,528 | 16,212 | 16,037 |
| Employee Benefits | 285 | 260 | 231 | 263 | 243 |
| Operating Expenses | 29 | 27 | -2 | 27 | 25 |
| TOTAL | 18,826 | 18,097 | 14,756 | 16,502 | 16,306 |
FY2012 Spending Category Chart
