|
FY2012 House 1 |
FY2012 House Final |
FY2012 Senate Final |
FY2012 GAA |
|
|---|---|---|---|---|
| Budget Tracking | 7,988,207 | 7,988,207 | 7,988,207 | 7,988,207 |
|
FY2009 GAA |
FY2010 GAA |
FY2011 GAA |
FY2011 Projected |
FY2012 GAA |
|
|---|---|---|---|---|---|
| Historical Budget Levels | 9,383,215 | 7,834,053 | 8,055,655 | 8,075,090 | 7,988,207 |
* GAA is General Appropriation Act.
| SPENDING CATEGORY |
FY2008 Expended |
FY2009 Expended |
FY2010 Expended |
FY2011 Projected |
FY2012 GAA |
|---|---|---|---|---|---|
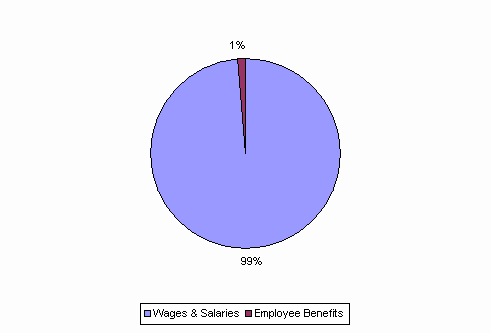
| Wages & Salaries | 9,025 | 8,751 | 7,127 | 7,959 | 7,881 |
| Employee Benefits | 69 | 115 | 98 | 116 | 107 |
| Operating Expenses | 67 | 0 | 0 | 0 | 0 |
| TOTAL | 9,161 | 8,866 | 7,225 | 8,075 | 7,988 |
FY2012 Spending Category Chart