|
FY2012 House 1 |
FY2012 House Final |
FY2012 Senate Final |
FY2012 GAA |
|
|---|---|---|---|---|
| Budget Tracking | 417,982,753 | 417,982,753 | 417,982,753 | 417,982,753 |
|
FY2009 GAA |
FY2010 GAA |
FY2011 GAA |
FY2011 Projected |
FY2012 GAA |
|
|---|---|---|---|---|---|
| Historical Budget Levels | 492,251,998 | 411,898,263 | 424,055,456 | 429,540,642 | 417,982,753 |
* GAA is General Appropriation Act.
| SPENDING CATEGORY |
FY2008 Expended |
FY2009 Expended |
FY2010 Expended |
FY2011 Projected |
FY2012 GAA |
|---|---|---|---|---|---|
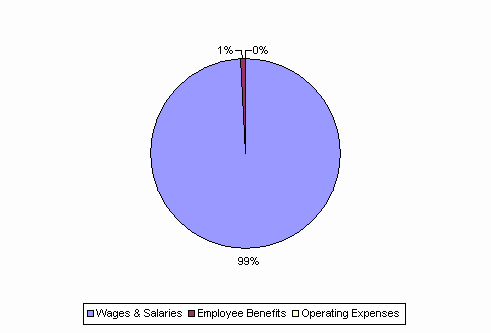
| Wages & Salaries | 478,678 | 462,344 | 379,072 | 426,345 | 414,433 |
| Employee Benefits | 5,147 | 3,088 | 828 | 3,191 | 3,545 |
| Operating Expenses | 134 | 5 | 0 | 5 | 4 |
| TOTAL | 483,960 | 465,436 | 379,900 | 429,541 | 417,983 |
FY2012 Spending Category Chart
