|
FY2012 House 1 |
FY2012 House Final |
FY2012 Senate Final |
FY2012 GAA |
|
|---|---|---|---|---|
| Budget Tracking | 1,673,842 | 1,657,950 | 1,624,791 | 1,624,791 |
|
FY2009 GAA |
FY2010 GAA |
FY2011 GAA |
FY2011 Projected |
FY2012 GAA |
|
|---|---|---|---|---|---|
| Historical Budget Levels | 6,512,898 | 1,933,249 | 1,570,984 | 1,673,842 | 1,624,791 |
* GAA is General Appropriation Act.
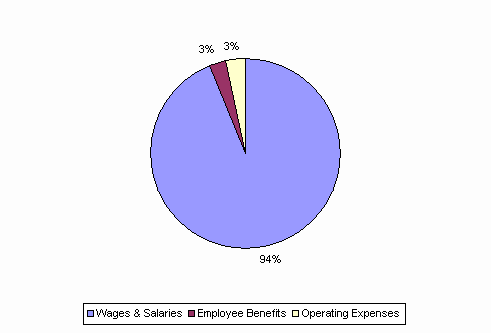
| SPENDING CATEGORY |
FY2008 Expended |
FY2009 Expended |
FY2010 Expended |
FY2011 Projected |
FY2012 GAA |
|---|---|---|---|---|---|
| Wages & Salaries | 1,976 | 1,944 | 1,664 | 1,567 | 1,523 |
| Employee Benefits | 50 | 51 | 47 | 46 | 46 |
| Operating Expenses | 865 | 1,716 | 172 | 60 | 56 |
| Grants & Subsidies | 533 | 2,395 | 0 | 0 | 0 |
| TOTAL | 3,424 | 6,106 | 1,883 | 1,674 | 1,625 |
FY2012 Spending Category Chart