|
FY2012 House 1 |
FY2012 House Final |
FY2012 Senate Final |
FY2012 GAA |
|
|---|---|---|---|---|
| Budget Tracking | 4,411,611 | 4,121,215 | 4,121,215 | 4,121,215 |
|
FY2009 GAA |
FY2010 GAA |
FY2011 GAA |
FY2011 Projected |
FY2012 GAA |
|
|---|---|---|---|---|---|
| Historical Budget Levels | 4,277,635 | 4,177,632 | 4,121,215 | 5,268,362 | 4,121,215 |
* GAA is General Appropriation Act.
| SPENDING CATEGORY |
FY2008 Expended |
FY2009 Expended |
FY2010 Expended |
FY2011 Projected |
FY2012 GAA |
|---|---|---|---|---|---|
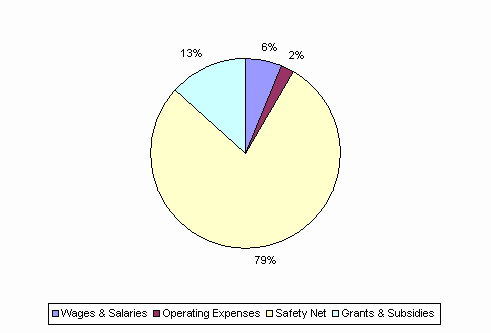
| Wages & Salaries | 434 | 250 | 250 | 419 | 250 |
| Operating Expenses | 93 | 87 | 76 | 111 | 99 |
| Safety Net | 3,099 | 3,465 | 3,483 | 4,131 | 3,223 |
| Grants & Subsidies | 433 | 573 | 532 | 607 | 550 |
| TOTAL | 4,059 | 4,374 | 4,342 | 5,268 | 4,121 |
FY2012 Spending Category Chart
