|
FY2012 House 1 |
FY2012 House Final |
FY2012 Senate Final |
FY2012 GAA |
|
|---|---|---|---|---|
| Budget Tracking | 2,703,732 | 2,708,411 | 2,703,732 | 2,703,732 |
|
FY2009 GAA |
FY2010 GAA |
FY2011 GAA |
FY2011 Projected |
FY2012 GAA |
|
|---|---|---|---|---|---|
| Historical Budget Levels | 2,513,616 | 2,685,874 | 2,653,105 | 2,653,105 | 2,703,732 |
* GAA is General Appropriation Act.
| SPENDING CATEGORY |
FY2008 Expended |
FY2009 Expended |
FY2010 Expended |
FY2011 Projected |
FY2012 GAA |
|---|---|---|---|---|---|
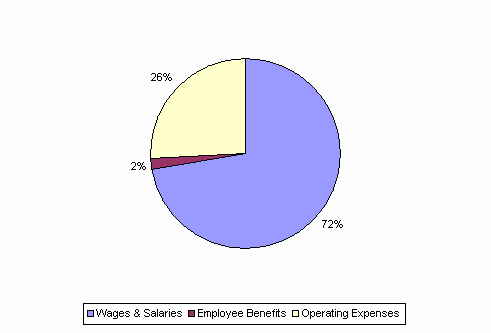
| Wages & Salaries | 1,818 | 1,795 | 1,751 | 1,908 | 1,950 |
| Employee Benefits | 35 | 40 | 39 | 52 | 53 |
| Operating Expenses | 289 | 480 | 754 | 694 | 700 |
| TOTAL | 2,143 | 2,314 | 2,544 | 2,653 | 2,704 |
FY2012 Spending Category Chart
