|
FY2012 House 1 |
FY2012 House Final |
FY2012 Senate Final |
FY2012 GAA |
|
|---|---|---|---|---|
| Budget Tracking | 13,242,123 | 13,203,351 | 13,242,123 | 13,203,351 |
|
FY2009 GAA |
FY2010 GAA |
FY2011 GAA |
FY2011 Projected |
FY2012 GAA |
|
|---|---|---|---|---|---|
| Historical Budget Levels | 12,582,991 | 12,931,502 | 12,815,333 | 12,815,333 | 13,203,351 |
* GAA is General Appropriation Act.
| SPENDING CATEGORY |
FY2008 Expended |
FY2009 Expended |
FY2010 Expended |
FY2011 Projected |
FY2012 GAA |
|---|---|---|---|---|---|
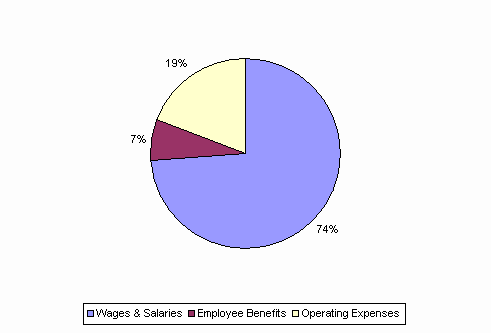
| Wages & Salaries | 9,616 | 9,455 | 9,413 | 9,369 | 9,753 |
| Employee Benefits | 846 | 854 | 819 | 914 | 918 |
| Operating Expenses | 1,912 | 1,743 | 2,271 | 2,533 | 2,533 |
| TOTAL | 12,374 | 12,051 | 12,503 | 12,815 | 13,203 |
FY2012 Spending Category Chart
