|
FY2012 House 1 |
FY2012 House Final |
FY2012 Senate Final |
FY2012 GAA |
|
|---|---|---|---|---|
| Budget Tracking | 843,578 | 914,448 | 817,877 | 914,448 |
|
FY2009 GAA |
FY2010 GAA |
FY2011 GAA |
FY2011 Projected |
FY2012 GAA |
|
|---|---|---|---|---|---|
| Historical Budget Levels | 1,048,560 | 938,042 | 914,448 | 914,448 | 914,448 |
* GAA is General Appropriation Act.
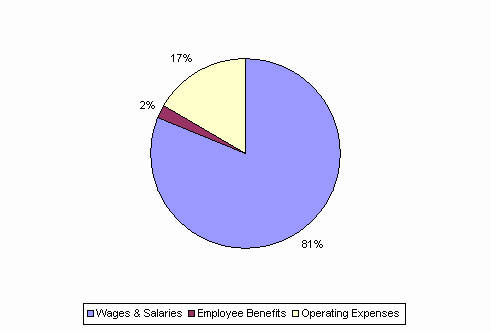
| SPENDING CATEGORY |
FY2008 Expended |
FY2009 Expended |
FY2010 Expended |
FY2011 Projected |
FY2012 GAA |
|---|---|---|---|---|---|
| Wages & Salaries | 928 | 896 | 781 | 767 | 743 |
| Employee Benefits | 19 | 19 | 17 | 20 | 20 |
| Operating Expenses | 115 | 120 | 132 | 128 | 152 |
| TOTAL | 1,062 | 1,035 | 930 | 914 | 914 |
FY2012 Spending Category Chart