|
FY2012 House 1 |
FY2012 House Final |
FY2012 Senate Final |
FY2012 GAA |
|
|---|---|---|---|---|
| Budget Tracking | 142,571,593 | 142,156,836 | 142,156,836 | 142,156,836 |
|
FY2009 GAA |
FY2010 GAA |
FY2011 GAA |
FY2011 Projected |
FY2012 GAA |
|
|---|---|---|---|---|---|
| Historical Budget Levels | 187,545,814 | 161,581,427 | 149,993,472 | 160,073,649 | 142,156,836 |
* GAA is General Appropriation Act.
| SPENDING CATEGORY |
FY2008 Expended |
FY2009 Expended |
FY2010 Expended |
FY2011 Projected |
FY2012 GAA |
|---|---|---|---|---|---|
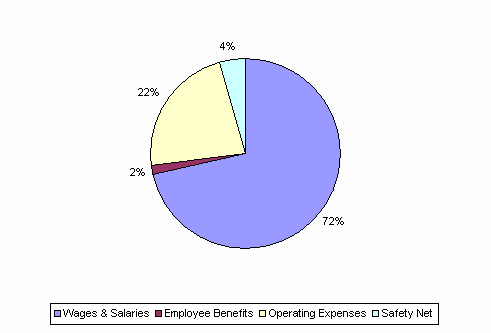
| Wages & Salaries | 135,093 | 129,724 | 121,586 | 104,902 | 101,493 |
| Employee Benefits | 165 | 1,861 | 1,912 | 2,322 | 2,306 |
| Operating Expenses | 41,904 | 41,080 | 36,641 | 33,592 | 31,967 |
| Safety Net | 6,173 | 6,241 | 3,998 | 19,258 | 6,392 |
| TOTAL | 183,335 | 178,906 | 164,137 | 160,074 | 142,157 |
FY2012 Spending Category Chart
