|
FY2012 House 1 |
FY2012 House Final |
FY2012 Senate Final |
FY2012 GAA |
|
|---|---|---|---|---|
| Budget Tracking | 164,790,661 | 164,790,661 | 164,194,179 | 164,790,661 |
|
FY2009 GAA |
FY2010 GAA |
FY2011 GAA |
FY2011 Projected |
FY2012 GAA |
|
|---|---|---|---|---|---|
| Historical Budget Levels | 137,437,683 | 144,559,478 | 142,989,359 | 154,079,275 | 164,790,661 |
* GAA is General Appropriation Act.
| SPENDING CATEGORY |
FY2008 Expended |
FY2009 Expended |
FY2010 Expended |
FY2011 Projected |
FY2012 GAA |
|---|---|---|---|---|---|
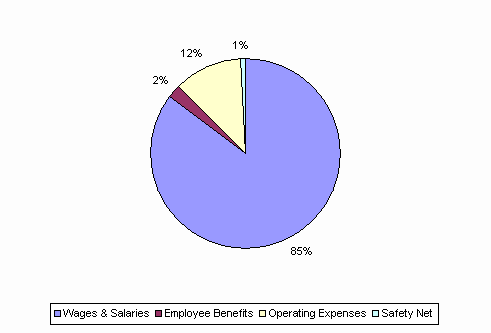
| Wages & Salaries | 118,999 | 118,668 | 122,808 | 130,134 | 140,524 |
| Employee Benefits | 1,211 | 2,763 | 2,830 | 3,692 | 3,823 |
| Operating Expenses | 16,419 | 16,800 | 17,301 | 19,040 | 19,268 |
| Safety Net | 1,021 | 1,200 | 1,219 | 1,213 | 1,176 |
| TOTAL | 137,649 | 139,430 | 144,158 | 154,079 | 164,791 |
FY2012 Spending Category Chart
