|
FY2012 House 1 |
FY2012 House Final |
FY2012 Senate Final |
FY2012 GAA |
|
|---|---|---|---|---|
| Budget Tracking | 60,672,283 | 60,672,283 | 57,613,847 | 60,672,283 |
|
FY2009 GAA |
FY2010 GAA |
FY2011 GAA |
FY2011 Projected |
FY2012 GAA |
|
|---|---|---|---|---|---|
| Historical Budget Levels | 73,863,906 | 67,224,506 | 57,155,673 | 60,154,828 | 60,672,283 |
* GAA is General Appropriation Act.
| SPENDING CATEGORY |
FY2008 Expended |
FY2009 Expended |
FY2010 Expended |
FY2011 Projected |
FY2012 GAA |
|---|---|---|---|---|---|
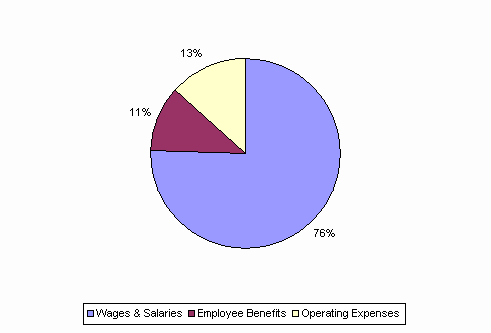
| Wages & Salaries | 56,064 | 55,567 | 51,581 | 45,823 | 45,820 |
| Employee Benefits | 10,823 | 7,006 | 6,725 | 6,882 | 6,826 |
| Operating Expenses | 9,807 | 9,118 | 6,859 | 7,450 | 8,026 |
| Safety Net | 1 | 0 | 0 | 0 | 0 |
| TOTAL | 76,695 | 71,691 | 65,165 | 60,155 | 60,672 |
FY2012 Spending Category Chart
