|
FY2012 House 1 |
FY2012 House Final |
FY2012 Senate Final |
FY2012 GAA |
|
|---|---|---|---|---|
| Budget Tracking | 20,129,711 | 20,125,062 | 20,770,858 | 20,725,062 |
|
FY2009 GAA |
FY2010 GAA |
FY2011 GAA |
FY2011 Projected |
FY2012 GAA |
|
|---|---|---|---|---|---|
| Historical Budget Levels | 23,473,406 | 21,925,460 | 20,094,458 | 20,094,458 | 20,725,062 |
* GAA is General Appropriation Act.
| SPENDING CATEGORY |
FY2008 Expended |
FY2009 Expended |
FY2010 Expended |
FY2011 Projected |
FY2012 GAA |
|---|---|---|---|---|---|
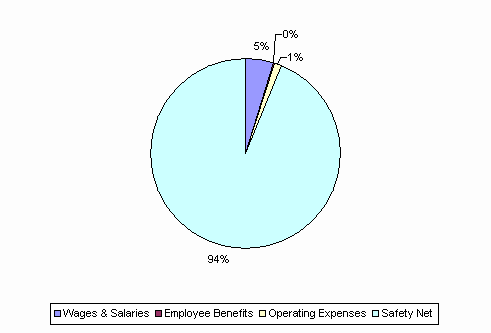
| Wages & Salaries | 1,167 | 957 | 938 | 932 | 1,003 |
| Employee Benefits | 10 | 22 | 27 | 32 | 33 |
| Operating Expenses | 208 | 292 | 225 | 246 | 252 |
| Safety Net | 21,327 | 21,937 | 20,138 | 18,884 | 19,436 |
| Grants & Subsidies | 60 | 60 | 0 | 0 | 0 |
| TOTAL | 22,772 | 23,269 | 21,327 | 20,094 | 20,725 |
FY2012 Spending Category Chart
