|
FY2012 House 1 |
FY2012 House Final |
FY2012 Senate Final |
FY2012 GAA |
|
|---|---|---|---|---|
| Budget Tracking | 3,035,868 | 2,824,059 | 3,035,868 | 2,824,059 |
|
FY2009 GAA |
FY2010 GAA |
FY2011 GAA |
FY2011 Projected |
FY2012 GAA |
|
|---|---|---|---|---|---|
| Historical Budget Levels | 2,976,282 | 2,689,807 | 2,671,274 | 2,846,992 | 2,824,059 |
* GAA is General Appropriation Act.
| SPENDING CATEGORY |
FY2008 Expended |
FY2009 Expended |
FY2010 Expended |
FY2011 Projected |
FY2012 GAA |
|---|---|---|---|---|---|
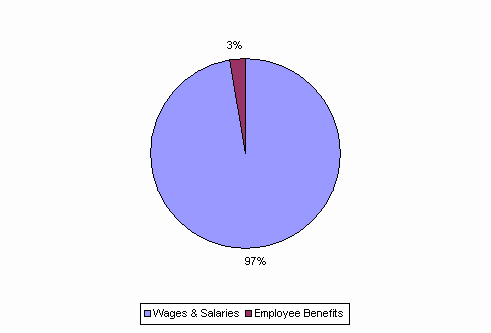
| Wages & Salaries | 2,845 | 2,692 | 2,563 | 2,759 | 2,742 |
| Employee Benefits | 59 | 69 | 70 | 88 | 82 |
| Operating Expenses | 49 | 0 | 0 | 0 | 0 |
| TOTAL | 2,952 | 2,761 | 2,633 | 2,847 | 2,824 |
FY2012 Spending Category Chart
