|
FY2012 House 1 |
FY2012 House Final |
FY2012 Senate Final |
FY2012 GAA |
|
|---|---|---|---|---|
| Budget Tracking | 16,457,488 | 16,212,194 | 16,457,488 | 16,457,488 |
|
FY2009 GAA |
FY2010 GAA |
FY2011 GAA |
FY2011 Projected |
FY2012 GAA |
|
|---|---|---|---|---|---|
| Historical Budget Levels | 16,542,017 | 16,554,915 | 16,400,049 | 16,400,049 | 16,457,488 |
* GAA is General Appropriation Act.
| SPENDING CATEGORY |
FY2008 Expended |
FY2009 Expended |
FY2010 Expended |
FY2011 Projected |
FY2012 GAA |
|---|---|---|---|---|---|
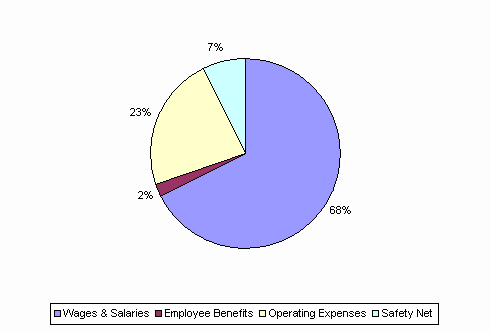
| Wages & Salaries | 11,179 | 11,497 | 11,131 | 11,046 | 11,102 |
| Employee Benefits | 326 | 321 | 321 | 377 | 378 |
| Operating Expenses | 3,154 | 3,366 | 3,751 | 3,769 | 3,769 |
| Safety Net | 1,105 | 986 | 971 | 1,208 | 1,208 |
| TOTAL | 15,763 | 16,170 | 16,174 | 16,400 | 16,457 |
FY2012 Spending Category Chart
