|
FY2012 House 1 |
FY2012 House Final |
FY2012 Senate Final |
FY2012 GAA |
|
|---|---|---|---|---|
| Budget Tracking | 4,485,983 | 4,485,983 | 4,150,703 | 4,150,703 |
|
FY2009 GAA |
FY2010 GAA |
FY2011 GAA |
FY2011 Projected |
FY2012 GAA |
|
|---|---|---|---|---|---|
| Historical Budget Levels | 12,750,000 | 5,001,077 | 4,485,983 | 4,485,983 | 4,150,703 |
* GAA is General Appropriation Act.
| SPENDING CATEGORY |
FY2008 Expended |
FY2009 Expended |
FY2010 Expended |
FY2011 Projected |
FY2012 GAA |
|---|---|---|---|---|---|
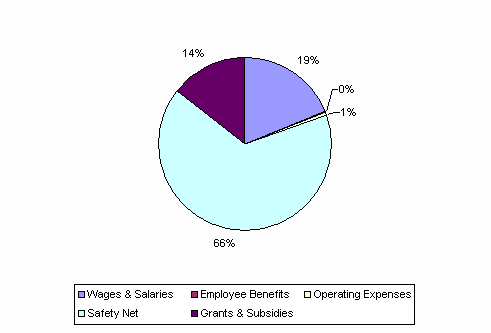
| Wages & Salaries | 3,210 | 1,912 | 522 | 782 | 782 |
| Employee Benefits | 11 | 6 | 4 | 12 | 12 |
| Operating Expenses | 164 | 274 | 38 | 21 | 21 |
| Safety Net | 6,754 | 7,378 | 3,249 | 3,073 | 2,738 |
| Grants & Subsidies | 2,356 | 2,536 | 674 | 598 | 598 |
| TOTAL | 12,494 | 12,106 | 4,487 | 4,486 | 4,151 |
FY2012 Spending Category Chart
