|
FY2012 House 1 |
FY2012 House Final |
FY2012 Senate Final |
FY2012 GAA |
|
|---|---|---|---|---|
| Budget Tracking | 6,774,418 | 5,992,959 | 6,493,455 | 6,242,959 |
|
FY2009 GAA |
FY2010 GAA |
FY2011 GAA |
FY2011 Projected |
FY2012 GAA |
|
|---|---|---|---|---|---|
| Historical Budget Levels | 8,817,714 | 7,286,521 | 6,768,109 | 6,768,109 | 6,242,959 |
* GAA is General Appropriation Act.
| SPENDING CATEGORY |
FY2008 Expended |
FY2009 Expended |
FY2010 Expended |
FY2011 Projected |
FY2012 GAA |
|---|---|---|---|---|---|
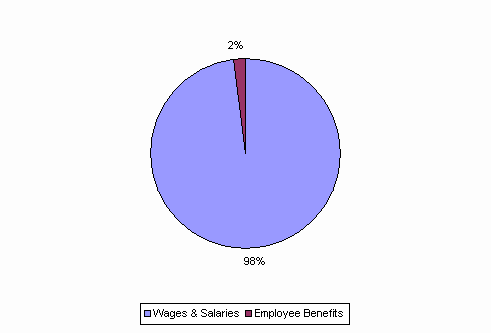
| Wages & Salaries | 8,535 | 8,464 | 6,896 | 6,641 | 6,126 |
| Employee Benefits | 0 | 111 | 95 | 127 | 117 |
| TOTAL | 8,535 | 8,574 | 6,991 | 6,768 | 6,243 |
FY2012 Spending Category Chart
