|
FY2012 House 1 |
FY2012 House Final |
FY2012 Senate Final |
FY2012 GAA |
|
|---|---|---|---|---|
| Budget Tracking | 1,661,878 | 1,624,791 | 1,674,716 | 1,764,716 |
|
FY2009 GAA |
FY2010 GAA |
FY2011 GAA |
FY2011 Projected |
FY2012 GAA |
|
|---|---|---|---|---|---|
| Historical Budget Levels | 1,576,652 | 1,574,783 | 1,661,878 | 1,661,878 | 1,764,716 |
* GAA is General Appropriation Act.
| SPENDING CATEGORY |
FY2008 Expended |
FY2009 Expended |
FY2010 Expended |
FY2011 Projected |
FY2012 GAA |
|---|---|---|---|---|---|
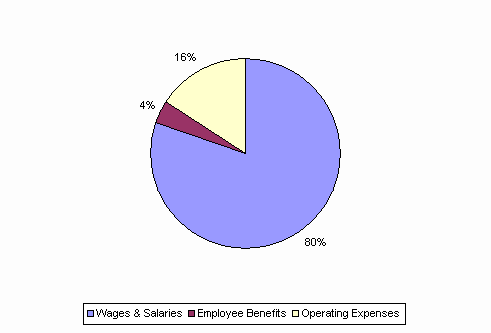
| Wages & Salaries | 1,033 | 1,081 | 1,175 | 1,325 | 1,416 |
| Employee Benefits | 37 | 55 | 50 | 65 | 70 |
| Operating Expenses | 336 | 390 | 246 | 272 | 279 |
| TOTAL | 1,407 | 1,526 | 1,471 | 1,662 | 1,765 |
FY2012 Spending Category Chart
