|
FY2012 House 1 |
FY2012 House Final |
FY2012 Senate Final |
FY2012 GAA |
|
|---|---|---|---|---|
| Budget Tracking | 6,577,740 | 6,577,740 | 6,436,708 | 6,436,708 |
|
FY2009 GAA |
FY2010 GAA |
FY2011 GAA |
FY2011 Projected |
FY2012 GAA |
|
|---|---|---|---|---|---|
| Historical Budget Levels | 6,927,953 | 6,576,576 | 6,576,576 | 6,576,576 | 6,436,708 |
* GAA is General Appropriation Act.
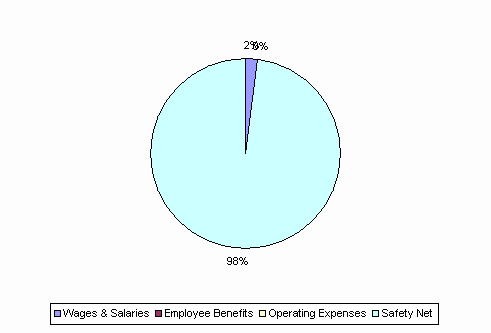
| SPENDING CATEGORY |
FY2008 Expended |
FY2009 Expended |
FY2010 Expended |
FY2011 Projected |
FY2012 GAA |
|---|---|---|---|---|---|
| Wages & Salaries | 107 | 113 | 115 | 124 | 120 |
| Employee Benefits | 3 | 2 | 3 | 6 | 6 |
| Operating Expenses | 23 | 11 | 5 | 8 | 7 |
| Safety Net | 6,610 | 6,759 | 6,401 | 6,438 | 6,304 |
| TOTAL | 6,742 | 6,886 | 6,523 | 6,577 | 6,437 |
FY2012 Spending Category Chart