|
FY2012 House 1 |
FY2012 House Final |
FY2012 Senate Final |
FY2012 GAA |
|
|---|---|---|---|---|
| Budget Tracking | 53,097,438 | 53,097,438 | 53,084,416 | 53,084,416 |
|
FY2009 GAA |
FY2010 GAA |
FY2011 GAA |
FY2011 Projected |
FY2012 GAA |
|
|---|---|---|---|---|---|
| Historical Budget Levels | 68,136,719 | 52,727,596 | 51,584,416 | 51,584,416 | 53,084,416 |
* GAA is General Appropriation Act.
| SPENDING CATEGORY |
FY2008 Expended |
FY2009 Expended |
FY2010 Expended |
FY2011 Projected |
FY2012 GAA |
|---|---|---|---|---|---|
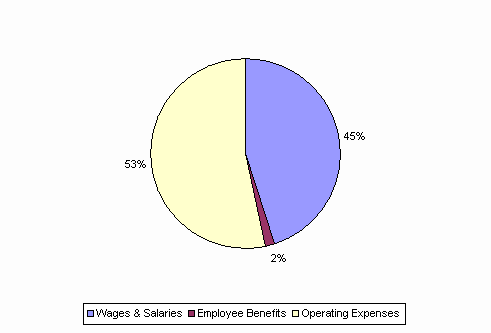
| Wages & Salaries | 31,550 | 31,179 | 23,574 | 22,532 | 23,953 |
| Employee Benefits | 1,121 | 1,081 | 658 | 750 | 824 |
| Operating Expenses | 34,694 | 32,368 | 26,494 | 28,303 | 28,307 |
| TOTAL | 67,365 | 64,628 | 50,726 | 51,584 | 53,084 |
FY2012 Spending Category Chart
