|
FY2012 House 1 |
FY2012 House Final |
FY2012 Senate Final |
FY2012 GAA |
|
|---|---|---|---|---|
| Budget Tracking | 93,590,327 | 96,421,853 | 93,039,491 | 95,970,712 |
|
FY2009 GAA |
FY2010 GAA |
FY2011 GAA |
FY2011 Projected |
FY2012 GAA |
|
|---|---|---|---|---|---|
| Historical Budget Levels | 105,563,546 | 99,326,675 | 96,421,853 | 96,424,955 | 95,970,712 |
* GAA is General Appropriation Act.
| SPENDING CATEGORY |
FY2008 Expended |
FY2009 Expended |
FY2010 Expended |
FY2011 Projected |
FY2012 GAA |
|---|---|---|---|---|---|
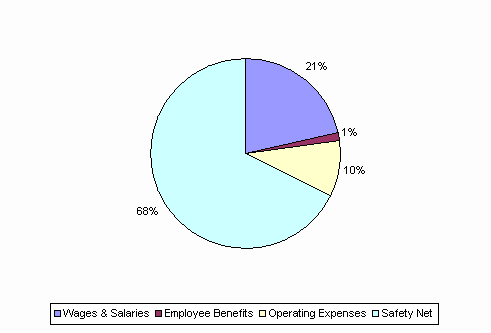
| Wages & Salaries | 19,463 | 19,818 | 19,918 | 20,164 | 20,566 |
| Employee Benefits | 556 | 836 | 1,237 | 1,353 | 1,226 |
| Operating Expenses | 10,193 | 10,250 | 8,970 | 8,507 | 9,220 |
| Safety Net | 72,918 | 68,842 | 65,670 | 66,401 | 64,959 |
| Debt Service | 0 | 0 | 0 | 0 | 0 |
| TOTAL | 103,130 | 99,745 | 95,794 | 96,425 | 95,971 |
FY2012 Spending Category Chart
