|
FY2012 House 1 |
FY2012 House Final |
FY2012 Senate Final |
FY2012 GAA |
|
|---|---|---|---|---|
| Budget Tracking | 21,619,063 | 21,498,016 | 21,619,063 | 21,619,063 |
|
FY2009 GAA |
FY2010 GAA |
FY2011 GAA |
FY2011 Projected |
FY2012 GAA |
|
|---|---|---|---|---|---|
| Historical Budget Levels | 22,828,627 | 21,813,030 | 21,619,063 | 21,619,063 | 21,619,063 |
* GAA is General Appropriation Act.
| SPENDING CATEGORY |
FY2008 Expended |
FY2009 Expended |
FY2010 Expended |
FY2011 Projected |
FY2012 GAA |
|---|---|---|---|---|---|
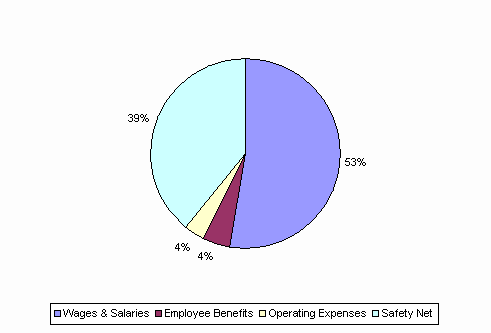
| Wages & Salaries | 11,941 | 11,530 | 11,526 | 11,437 | 11,422 |
| Employee Benefits | 867 | 1,077 | 1,010 | 990 | 968 |
| Operating Expenses | 749 | 844 | 734 | 790 | 768 |
| Safety Net | 8,771 | 9,289 | 7,907 | 8,402 | 8,461 |
| TOTAL | 22,328 | 22,741 | 21,177 | 21,619 | 21,619 |
FY2012 Spending Category Chart
