|
FY2012 House 1 |
FY2012 House Final |
FY2012 Senate Final |
FY2012 GAA |
|
|---|---|---|---|---|
| Budget Tracking | 25,940,788 | 25,940,788 | 25,940,788 | 25,940,788 |
|
FY2009 GAA |
FY2010 GAA |
FY2011 GAA |
FY2011 Projected |
FY2012 GAA |
|
|---|---|---|---|---|---|
| Historical Budget Levels | 26,968,587 | 25,963,213 | 25,940,788 | 25,940,788 | 25,940,788 |
* GAA is General Appropriation Act.
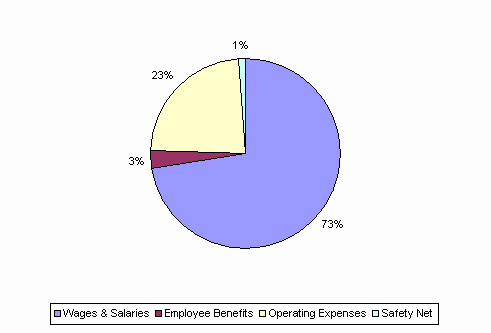
| SPENDING CATEGORY |
FY2008 Expended |
FY2009 Expended |
FY2010 Expended |
FY2011 Projected |
FY2012 GAA |
|---|---|---|---|---|---|
| Wages & Salaries | 19,337 | 19,170 | 18,223 | 18,665 | 18,834 |
| Employee Benefits | 612 | 494 | 587 | 730 | 769 |
| Operating Expenses | 5,809 | 6,174 | 6,236 | 6,269 | 6,061 |
| Safety Net | 504 | 446 | 225 | 277 | 277 |
| TOTAL | 26,261 | 26,284 | 25,271 | 25,941 | 25,941 |
FY2012 Spending Category Chart