|
FY2012 House 1 |
FY2012 House Final |
FY2012 Senate Final |
FY2012 GAA |
|
|---|---|---|---|---|
| Budget Tracking | 0 | 2,428,315 | 2,362,792 | 2,428,315 |
|
FY2009 GAA |
FY2010 GAA |
FY2011 GAA |
FY2011 Projected |
FY2012 GAA |
|
|---|---|---|---|---|---|
| Historical Budget Levels | 8,561,446 | 4,170,817 | 2,462,792 | 2,462,792 | 2,428,315 |
* GAA is General Appropriation Act.
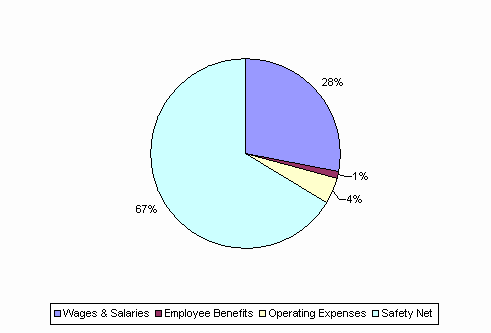
| SPENDING CATEGORY |
FY2008 Expended |
FY2009 Expended |
FY2010 Expended |
FY2011 Projected |
FY2012 GAA |
|---|---|---|---|---|---|
| Wages & Salaries | 745 | 711 | 711 | 732 | 683 |
| Employee Benefits | 28 | 29 | 27 | 32 | 27 |
| Operating Expenses | 97 | 120 | 100 | 100 | 106 |
| Safety Net | 7,575 | 6,535 | 1,613 | 1,599 | 1,613 |
| TOTAL | 8,445 | 7,395 | 2,452 | 2,463 | 2,428 |
FY2012 Spending Category Chart