|
FY2012 House 1 |
FY2012 House Final |
FY2012 Senate Final |
FY2012 GAA |
|
|---|---|---|---|---|
| Budget Tracking | 5,933,862 | 5,933,862 | 4,433,862 | 5,933,862 |
|
FY2009 GAA |
FY2010 GAA |
FY2011 GAA |
FY2011 Projected |
FY2012 GAA |
|
|---|---|---|---|---|---|
| Historical Budget Levels | 25,410,771 | 9,782,724 | 5,933,862 | 5,933,862 | 5,933,862 |
* GAA is General Appropriation Act.
| SPENDING CATEGORY |
FY2008 Expended |
FY2009 Expended |
FY2010 Expended |
FY2011 Projected |
FY2012 GAA |
|---|---|---|---|---|---|
| Wages & Salaries | 77 | 0 | 0 | 0 | 0 |
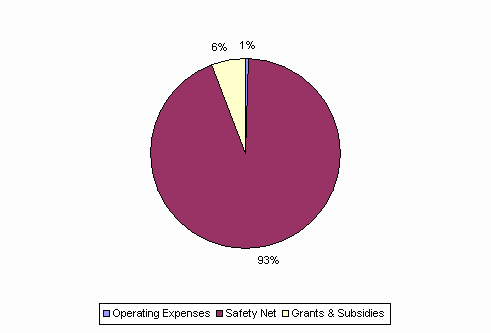
| Operating Expenses | 77 | 133 | 26 | 44 | 34 |
| Safety Net | 10,478 | 10,295 | 6,303 | 5,546 | 5,546 |
| Grants & Subsidies | 14,167 | 12,674 | 0 | 344 | 354 |
| TOTAL | 24,800 | 23,102 | 6,329 | 5,934 | 5,934 |
FY2012 Spending Category Chart
