|
FY2012 House 1 |
FY2012 House Final |
FY2012 Senate Final |
FY2012 GAA |
|
|---|---|---|---|---|
| Budget Tracking | 1,002,565 | 1,002,565 | 1,002,565 | 1,002,565 |
|
FY2009 GAA |
FY2010 GAA |
FY2011 GAA |
FY2011 Projected |
FY2012 GAA |
|
|---|---|---|---|---|---|
| Historical Budget Levels | 2,060,310 | 1,250,528 | 1,000,000 | 1,002,565 | 1,002,565 |
* GAA is General Appropriation Act.
| SPENDING CATEGORY |
FY2008 Expended |
FY2009 Expended |
FY2010 Expended |
FY2011 Projected |
FY2012 GAA |
|---|---|---|---|---|---|
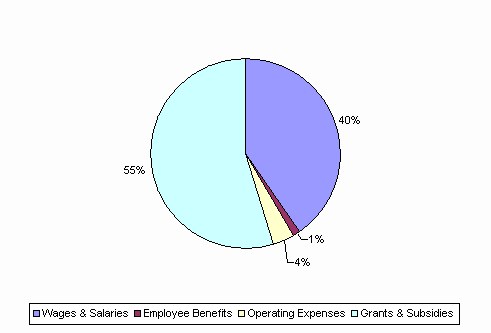
| Wages & Salaries | 989 | 809 | 639 | 401 | 405 |
| Employee Benefits | 25 | 21 | 16 | 15 | 14 |
| Operating Expenses | 197 | 52 | 43 | 39 | 36 |
| Grants & Subsidies | 1,753 | 548 | 548 | 548 | 548 |
| TOTAL | 2,964 | 1,430 | 1,245 | 1,003 | 1,003 |
FY2012 Spending Category Chart
