|
FY2012 House 1 |
FY2012 House Final |
FY2012 Senate Final |
FY2012 GAA |
|
|---|---|---|---|---|
| Budget Tracking | 411,038 | 406,510 | 410,511 | 406,510 |
|
FY2009 GAA |
FY2010 GAA |
FY2011 GAA |
FY2011 Projected |
FY2012 GAA |
|
|---|---|---|---|---|---|
| Historical Budget Levels | 497,148 | 401,130 | 401,130 | 401,130 | 406,510 |
* GAA is General Appropriation Act.
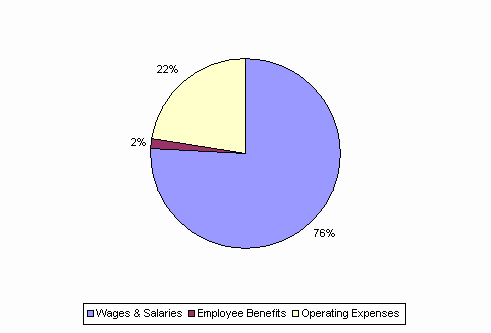
| SPENDING CATEGORY |
FY2008 Expended |
FY2009 Expended |
FY2010 Expended |
FY2011 Projected |
FY2012 GAA |
|---|---|---|---|---|---|
| Wages & Salaries | 260 | 260 | 259 | 293 | 308 |
| Employee Benefits | 5 | 8 | 6 | 9 | 7 |
| Operating Expenses | 122 | 121 | 86 | 99 | 91 |
| TOTAL | 387 | 389 | 351 | 401 | 407 |
FY2012 Spending Category Chart