|
FY2012 House 1 |
FY2012 House Final |
FY2012 Senate Final |
FY2012 GAA |
|
|---|---|---|---|---|
| Budget Tracking | 1,668,486 | 1,667,239 | 1,657,263 | 1,667,239 |
|
FY2009 GAA |
FY2010 GAA |
FY2011 GAA |
FY2011 Projected |
FY2012 GAA |
|
|---|---|---|---|---|---|
| Historical Budget Levels | 2,104,090 | 1,957,473 | 1,657,263 | 1,657,263 | 1,667,239 |
* GAA is General Appropriation Act.
| SPENDING CATEGORY |
FY2008 Expended |
FY2009 Expended |
FY2010 Expended |
FY2011 Projected |
FY2012 GAA |
|---|---|---|---|---|---|
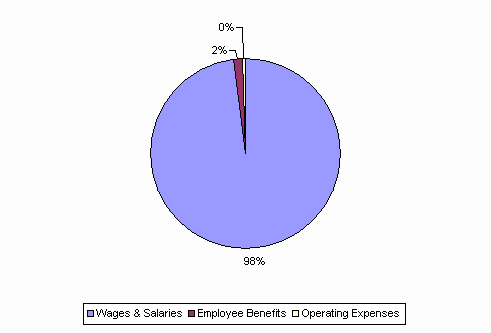
| Wages & Salaries | 1,864 | 1,739 | 1,599 | 1,623 | 1,634 |
| Employee Benefits | 27 | 24 | 23 | 27 | 26 |
| Operating Expenses | 0 | 6 | 5 | 7 | 7 |
| TOTAL | 1,891 | 1,770 | 1,627 | 1,657 | 1,667 |
FY2012 Spending Category Chart
