|
FY2012 House 1 |
FY2012 House Final |
FY2012 Senate Final |
FY2012 GAA |
|
|---|---|---|---|---|
| Budget Tracking | 2,362,778 | 2,402,778 | 2,148,506 | 2,173,506 |
|
FY2009 GAA |
FY2010 GAA |
FY2011 GAA |
FY2011 Projected |
FY2012 GAA |
|
|---|---|---|---|---|---|
| Historical Budget Levels | 2,338,552 | 2,159,172 | 2,133,506 | 2,146,208 | 2,173,506 |
* GAA is General Appropriation Act.
| SPENDING CATEGORY |
FY2008 Expended |
FY2009 Expended |
FY2010 Expended |
FY2011 Projected |
FY2012 GAA |
|---|---|---|---|---|---|
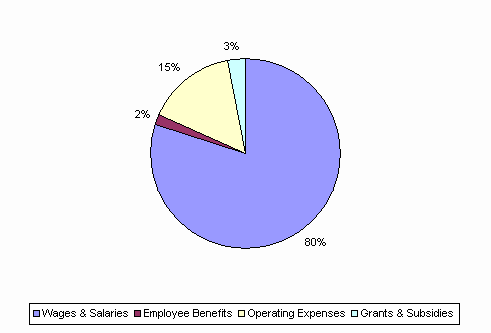
| Wages & Salaries | 1,790 | 1,792 | 1,685 | 1,761 | 1,737 |
| Employee Benefits | 28 | 30 | 30 | 41 | 41 |
| Operating Expenses | 357 | 351 | 368 | 345 | 331 |
| Grants & Subsidies | 34 | 67 | 0 | 0 | 65 |
| TOTAL | 2,209 | 2,240 | 2,083 | 2,146 | 2,174 |
FY2012 Spending Category Chart
