|
FY2012 House 1 |
FY2012 House Final |
FY2012 Senate Final |
FY2012 GAA |
|
|---|---|---|---|---|
| Budget Tracking | 22,251,155 | 22,251,155 | 22,251,155 | 22,251,155 |
|
FY2009 GAA |
FY2010 GAA |
FY2011 GAA |
FY2011 Projected |
FY2012 GAA |
|
|---|---|---|---|---|---|
| Historical Budget Levels | 27,410,277 | 23,452,981 | 22,705,260 | 22,705,260 | 22,251,155 |
* GAA is General Appropriation Act.
| SPENDING CATEGORY |
FY2008 Expended |
FY2009 Expended |
FY2010 Expended |
FY2011 Projected |
FY2012 GAA |
|---|---|---|---|---|---|
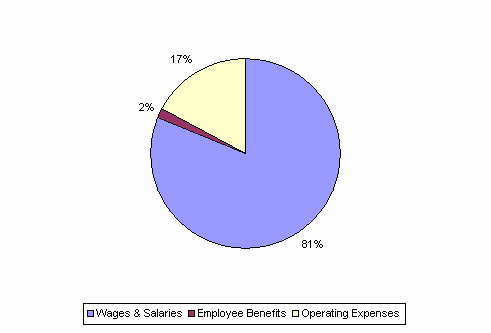
| Wages & Salaries | 19,933 | 20,941 | 18,844 | 18,353 | 18,019 |
| Employee Benefits | 472 | 460 | 371 | 407 | 408 |
| Operating Expenses | 4,826 | 4,486 | 3,711 | 3,946 | 3,824 |
| Grants & Subsidies | 1,318 | 1,420 | 0 | 0 | 0 |
| TOTAL | 26,549 | 27,307 | 22,925 | 22,705 | 22,251 |
FY2012 Spending Category Chart
