|
FY2012 House 1 |
FY2012 House Final |
FY2012 Senate Final |
FY2012 GAA |
|
|---|---|---|---|---|
| Budget Tracking | 2,183,764 | 2,228,331 | 2,161,481 | 2,161,481 |
|
FY2009 GAA |
FY2010 GAA |
FY2011 GAA |
FY2011 Projected |
FY2012 GAA |
|
|---|---|---|---|---|---|
| Historical Budget Levels | 2,788,908 | 2,345,612 | 2,228,331 | 2,228,331 | 2,161,481 |
* GAA is General Appropriation Act.
| SPENDING CATEGORY |
FY2008 Expended |
FY2009 Expended |
FY2010 Expended |
FY2011 Projected |
FY2012 GAA |
|---|---|---|---|---|---|
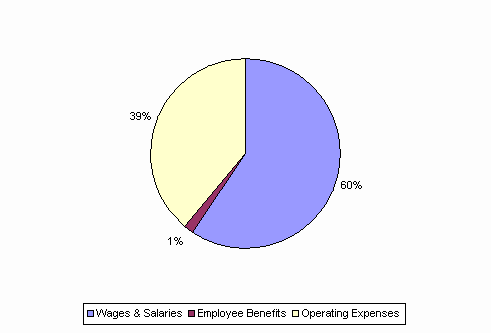
| Wages & Salaries | 1,795 | 1,792 | 1,505 | 1,452 | 1,288 |
| Employee Benefits | 34 | 40 | 24 | 49 | 31 |
| Operating Expenses | 905 | 847 | 800 | 728 | 843 |
| TOTAL | 2,734 | 2,679 | 2,329 | 2,228 | 2,161 |
FY2012 Spending Category Chart
