|
FY2012 House 1 |
FY2012 House Final |
FY2012 Senate Final |
FY2012 GAA |
|
|---|---|---|---|---|
| Budget Tracking | 1,125,092 | 1,148,053 | 1,113,611 | 1,113,611 |
|
FY2009 GAA |
FY2010 GAA |
FY2011 GAA |
FY2011 Projected |
FY2012 GAA |
|
|---|---|---|---|---|---|
| Historical Budget Levels | 1,436,869 | 1,208,477 | 1,148,053 | 1,148,089 | 1,113,611 |
* GAA is General Appropriation Act.
| SPENDING CATEGORY |
FY2008 Expended |
FY2009 Expended |
FY2010 Expended |
FY2011 Projected |
FY2012 GAA |
|---|---|---|---|---|---|
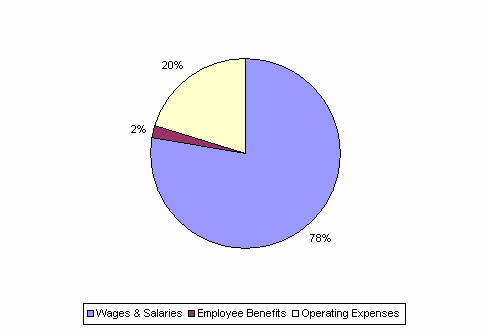
| Wages & Salaries | 1,165 | 1,102 | 945 | 887 | 866 |
| Employee Benefits | 17 | 16 | 14 | 38 | 20 |
| Operating Expenses | 253 | 115 | 239 | 223 | 227 |
| TOTAL | 1,435 | 1,232 | 1,197 | 1,148 | 1,114 |
FY2012 Spending Category Chart
