|
FY2012 House 1 |
FY2012 House Final |
FY2012 Senate Final |
FY2012 GAA |
|
|---|---|---|---|---|
| Budget Tracking | 1,660,040 | 1,693,918 | 1,643,100 | 1,643,100 |
|
FY2009 GAA |
FY2010 GAA |
FY2011 GAA |
FY2011 Projected |
FY2012 GAA |
|
|---|---|---|---|---|---|
| Historical Budget Levels | 2,173,462 | 1,827,990 | 1,693,918 | 1,700,942 | 1,643,100 |
* GAA is General Appropriation Act.
| SPENDING CATEGORY |
FY2008 Expended |
FY2009 Expended |
FY2010 Expended |
FY2011 Projected |
FY2012 GAA |
|---|---|---|---|---|---|
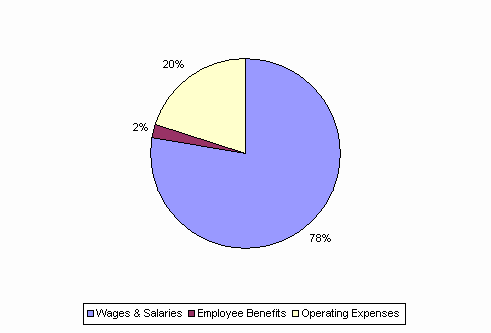
| Wages & Salaries | 1,475 | 1,448 | 1,336 | 1,309 | 1,279 |
| Employee Benefits | 39 | 35 | 27 | 34 | 35 |
| Operating Expenses | 693 | 603 | 453 | 358 | 329 |
| TOTAL | 2,206 | 2,086 | 1,817 | 1,701 | 1,643 |
FY2012 Spending Category Chart
